
Working With Multiple Data Sources and Aggregator Transformation

This tutorial shows the process of creating an Informatica PowerCenter mapping and workflow which pulls data from multiple data sources and summarize the data using Aggregator Transformation.
For the demonstration purpose lets consider an Inventory system maintains details of items, stock available, orders placed and customer related information. There are various requirements related to sales of an item. The company requires sales summary information.
Lets Create an Informatica PowerCenter Workflow to get the details.
- To get a summary of sales by item description, state and month,
- Collect data from various relational tables sources to consolidate the information.
- Create a relational target containing the summary wise details are created.
I. Start the Designer
- Start PowerCenter Designer.
- Connect to a Repository and open the folder.
- Open the Folder where you need the mapping created.
II. Create and verify source definitions
- Select SOURCES | IMPORT FROM DATABASE to import the ITEMS, ORDERS, ORDER_ITEMS and STORES tables. Hint: Press the Ctrl key while selecting each table with a single mouse click in the Import Tables box.
- In the Source Analyzer workbook , expand the Key Types column for each source definition.
- Verify primary/foreign key relationships by.

- Verifying Key Types.
- Observing the key relationships indicated by link lines between the tables, shown below.

III. Edit source definitions
- In the Description window of the ORDERS source definition, enter: “This is the ORDERS source table containing all of the orders for the company”
- Click in the Column Name column on the ORDER_ID line and enter In the Description window : “This is the order number uniquely distinguishing one order from another.”
- Save your work.


IV. Design a Target Schema
Assumption: The target table does not exist in the database.- Switch to Target Designer.
- Create a target schema from scratch and name it Tgt_SalesSummary_x. Your target should look like in the figure shown below.
- Create the physical table in the database so you can load data. Select the options as shown below Hint: Select TARGETS | GENERATE/EXECUTE SQL
- Click on Edit SQL file to view the script file created.
- Save the newly designed schema to the repository.


V. Drag sources and create Source Qualifier Transformation
- Switch to Mapping Designer.
- In Designer’s Navigator Window, select your folder.
- Create a new mapping.
- Enter M_SalesSummary_x for the new mapping name
- Disable automatic creation of Source Qualifier transformation. Hint : In TOOLS | OPTIONS, click on the Format tab.
- In Designer’s Navigator Window, expand the Sources section (node) in the Navigator Window, select the ITEMS, ORDER_ITEMS, ORDERS, and STORES tables and drag them to the far left side of the workspace.
- Create the Source Qualifier transformation
.
- Enter the name of the transformation and click on create. Select the sources in the Select Sources for Source Qualifier Transformation. Click on OK and Done.
Note: Blue link lines appear from the source definitions to the new Source. All columns (ports) from each of the four source definitions are linked into the new Source Qualifier.9. Rename the transformation to SQ_SalesSummary_x.


VI. Drag target into the Workspace
- Select the Tgt_SalesSummary_x table and drag it to the far right side of the workbook.
VII. Create the Expression transformation
- Create the
expression transformation and place it to the right of the Source Qualifier transformation.
- Link the following ports from the SQ_SalesSummary_x to the new Expression transformation: ITEM_DESC, PRICE, QUANTITY, DATE_ENTERED, STATE
Hint: Select the Link Columns icon in the toolbar.
- Rename the transformation to Exp_SalesSummary_x
VIII. Use functions in the Expression transformation
- Click on the Ports tab.
- Disable the output port of DATE_ENTERED column by removing the check mark in the options box in the ‘O’ column. This will make the port an input-only port.
- Add a new port and name it MONTH.Hint : Selecting the STATE port before clicking the
icon will add the new port immediately after STATE.
- Disable the input port to MONTH by removing the check mark in the options box in the ‘I’ column. The Expression section of MONTH becomes eligible for editing.
- Add a new port Year.
- Let Year be an output port.
- On the line for MONTH, click on the downward arrow to the far right of the Expression column. This opens the Expression Editor dialog box.
IX. Create the expression for the Month Port
- Enter the expression that defines MONTH in the Expression Editor.
- Delete the text MONTH.
- Select the Functions tab.
- Click on the ‘+’ next to Date to open the Date folder. A list of all date functions appears.
- Double-click the To_Char() function. The To_Char() function appears in the Formula Window.
- To define the port from which this function will extract the value for MONTH,select the Ports tab. All ports from all transformations in the mappings appear If you click on the ‘+’ next to each transformation
- Position the mouse in the parenthesis and double click the DATE_ENTERED port for the Expression transformation. DATE_ENTERED now appears within the expression you are building in the Formula: window, within the parentheses for the To_Char() function.
- Use the Keypad (below the Formula: window) to add a comma to the expression, after DATE_ENTERED.
- Then type ‘Month’. Include the single quotes.
- The expression is now complete. The finished expression should read: TO_CHAR(DATE_ENTERED, ‘Month’)
- Click Validate to parse the expression.
- After the expression has been parsed successfully, click OK to exit the Expression Editor.
X. Create the expression for Year
- Configure the Year port in a similar fashion as the MONTH port, entering the expression : TO_CHAR(DATE_ENTERED’ ‘YYYY’)
- Your Ports tab will look something like the following table:
- Click OK to exit the Edit Transformation dialog box.

XI. Create the Aggregator Transformation to get total price and total quantity
- Click on the aggregator transformation
icon in the toolbar .
- Click the mouse to the right of Exp_SalesSummary_x. An Aggregator transformation appears.
- Link the following columns from Exp_SalesSummary_x to the Aggregator transformation: ITEM_DESC, PRICE, QUANTITY, STATE, MONTH, and YEAR Hint : Drag the above columns from Expression transformation into Aggregator transformation. Make sure the link columns
icon is selected .
- Rename the transformation to Agg_SalesSummary_x
- Click OK.
- Click on the Ports tab.
- Disable the output ports for PRICE and QUANTITY. They will now be input-only ports.
- Add new ports for the TOTAL_QTY and TOTAL_PRICE. They will be output-only ports.
Note: The values for these ports will be calculated before data leaves the Aggregator. - Enter expressions for these two new ports in the Expression Editor. TOTAL_QTY : SUM(QUANTITY)
TOTAL_PRICE: SUM(QUANTITY * PRICE)
Hint : The SUM function is found in the Aggregate folder. It is not available for use in expressions in any transformation except the Aggregator transformation. - Validate the expressions.
- Check the GroupBy boxes on the lines for ITEM_DESC, STATE, MONTH, and YEAR These are the columns by which we want to summarize. Your Ports tab will look something like the table below:
Note : The order of GroupBy ports should be in the sequence as shown. Select theand
to move the column up and down.
- Click OK to exit the Edit Transformation dialog box.
- Link the following ports from Agg_SalesSummary_x to Tgt_SalesSummary_x
ITEM_DESCRIPTION ->DESCRIPTION
TOTAL_QTY –> TOTAL_QTY
TOTAL_PRICE –> TOTAL_PRICE
STATE –> STATE
MONTH –> MONTH
YEAR –> YEAR - Save changes to the repository.
- Review the information on Designer’s Output window.
- As the repository is saved, the Output window will display status information relevant to the metadata you have entered into the repository.
- If the mapping is invalid, make changes and validate the mapping again till valid.
Note: To save the cached output information in the Output window, select the tab so that the Output window shows messages related to the tab and select REPOSITORY | SAVE OUTPUT AS. - The Final mapping will look like the one given below.


XII. Create a Workflow and Session Task
- Start the Workflow Manager, connect to the repository and open your folder.
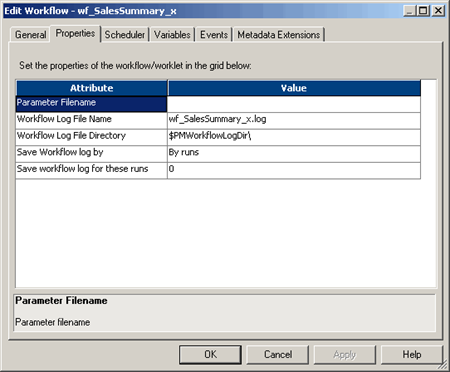
- Create a Workflow. Enter the workflow name as wf_SalesSummary_x.
- There are several parameters in the new workflow to be set. Under the Properties tab, note Attribute 2 displays the name of the Workflow Log File: wf_SalesSummary_x.log
- Add a session task
- Create a Session task and name it s_SalesSummary_x task
- Select the M_SalesSummary_x mapping from the list of valid mappings and click on OK.
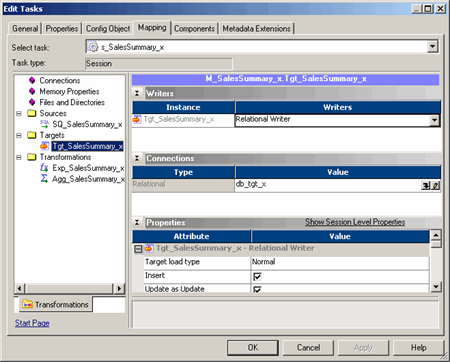
- Enter the following description and double click on the session task to edit the session properties
- Enter the description for the session in the General tab.
- Under the Properties tab, you can enter session log file name, session log file directory, and other general session settings.
- Select the Source Database Connection
- Select the Target Database Connection
- Select the Mapping tab and click on the Targets folder. Under Properties, select the Target load type as Normal.
- Select the Transformations tab. This section lets you override individual transformation attributes. Overrides may apply to any property on any transformation used within the mapping.
- Click OK to close the Edit Tasks dialog box.


XIII. Link Workflow Tasks
- Link Start_SalesSummary_x and s_SalesSummary_x.
- Validate the Workflow.
- Locate the Validate tab in the Output Window at the bottom of the Workflow Manager and view the results of the Validation checks.
- Repeat the validation process until the Workflow is valid.
- Save changes to the repository.
- Start the Workflow.

XIV. Monitor a Workflow
- Open Workflow Monitor.
- Select the Gantt Chart tab
- Double-click on the folder to view the previously processed workflows Drill down by double clicking on each object all the way until the session task s_SalesSummary_x, appears.
- Note the status of the s_SalesSummary_x session task.
- View the Session properties and check if it displays the number of Target Success Rows as shown below:
- Click on the Transformation Statistics tab. More detail on the number of rows handled by the Server are shown here:
- View Session Log and read the messages.


Video Tutorial
Hope you enjoy this tutorial, Please let us know if you have any difficulties in trying out these exercise.