
Understand Informatica PowerCenter Workflow Monitor
 You can monitor workflows and tasks in the Workflow Monitor. With the Workflow Monitor, you can view details about a workflow or task in Gantt Chart view or Task view. The Workflow Monitor displays workflows that have run at least once. You can run, stop, abort, and resume workflows from the Workflow Monitor. The Workflow Monitor continuously receives information from the Integration Service and Repository Service. It also fetches information from the repository to display historic information.
Start and Monitor The Workflow
- If the Workflow is valid, it is ready for execution. In the Workflow Manager, use one of the following methods to start the wf_Employee_Name_x Workflow. Please use the workflow created in the exercise Understand Informatica PowerCenter Workflow Designer
- Select WORKFLOWS | START WORKFLOW.
- Right-click in the Workspace and select Start Workflow or
- Right-click on the wf_Employee_Name_x Workflow in the Navigator Window and select Start Workflow.
- To monitor a Workflow the Workflow Monitor must be opened. This is opened automatically when a workflow is executed. If this does not happen perform the following steps to start the Workflow Monitor
- Select Start | Programs | Informatica PowerCenter Client | Workflow Monitor.
- To connect to Repository use one of the following methods:
- In the Workflow Monitor Select REPOSITORY | CONNECT or
- Click on the
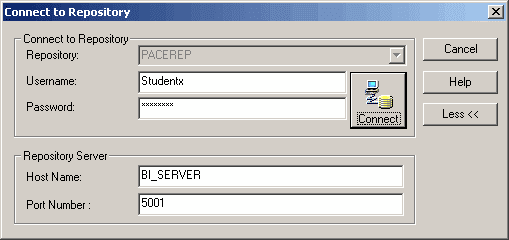
icon in the toolbar; or double-click on Repository in the Navigator Window. The Connect To Repository box appears.
- Select the repository from the Repository pull-down list.
- Enter the Username in the Username box.
- Enter the Password in the Password box.
- Enter the Hostname and Port Number details; The Host/Port Number is communication link where the Server machine is listening for client requests.
- Note: Enter repository, server and login details.
- Right click on the server name and select Connect.
- Double click on the folder to view Workflow sessions.
- You get two views, the Gantt Chart View and the Task View.

- Select the Gantt Chart tab. This view displays details about workflow runs in chronological format. It displays the following information as shown below.

- Select the Task View. This view displays details about workflow runs in a report format. The Status column gives the following information.

- A Succeeded status if the PowerCenter Server was able to successfully complete a Workflow or Task.
- A Failed status may occur if the PowerCenter Server failed the Workflow or Task due to fatal processing errors.
- A Running status if the PowerCenter Server is still processing is still processing Workflow or Task.
- View the Session properties by doing one of the following.
- Right click on the Session selected and select Properties; or
- Click on the Session Properties
icon.
- The Properties tab of the S_Employee_Name_x dialog box opens. The Session should display the number of Target Success Rows as shown below.

- Click on the Transformation Statistics tab. More detail on the number of rows handled by the Server are shown here.

- Applied rows are rows the Informatica Server successfully produced and applied to the target without errors.
- Affected rows are generated by the Server and ‘affected to’ (or accepted by) the target.
- Rejected rows are either those read rows that the Server dropped during the transformation process, or, the rows that were rejected when writing to the target.
- View Session Log to determine what occurred during the system run. To view detailed Session information, do one of the following
- Right-click on the Session in the Name column and select Get Session Log.
- Select the Session name and click on the
icon.

Video Tutorial.
In this demonstration video we will see how we can use Workflow Monitor.
Hope you enjoy this tutorial, Please let us know if you have any difficulties in trying out these exercise.